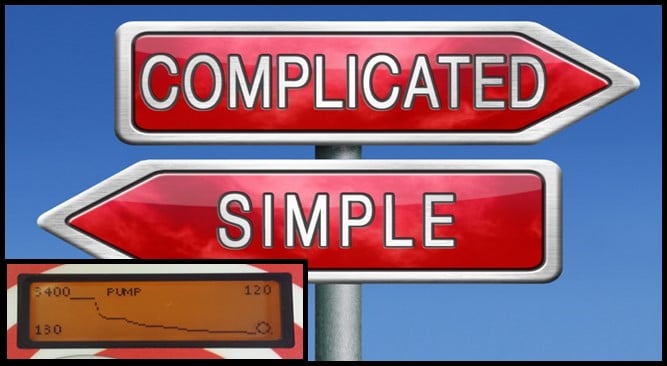
Taking the Guesswork Out of Pumpdown Curves
Everyone knows that keeping track of your vacuum system pumpdown curves is important and a valuable asset in troubleshooting leaks in the system. However, creating pumpdown curves aren’t always easy and can take too much of your valuable time!
Keeping Watch
Who wants an unexpected shut down? No one! Keeping a constant watch on your vacuum process system’s performance and operation is vital to spot the onset of a potential problem before it becomes a REAL PROBLEM ruining your process run and potentially causing a system shut-down.
There are some simple and practical tools that can help:
- Identify developing problems
- Help diagnose their source
- Indicate possible solutions
The residual gas analyzer (RGA) is probably the most generally accepted tool for monitoring performance and troubleshooting. As with most instruments, their use is only as valuable as how well they are used.
Problems with Relying on RGA
- Small changes in total pressure can be missed—when those changes are distributed over a number of mass peaks
- Although most RGA’s are fully capable of providing the required precision and accuracy, the handling of the data, either mentally or with a computer, can allow the advantages to be lost.
Pumpdown and Rate-Of-Rise curves are simple tools that can be used in addition to RGA monitoring and for those systems that don’t have an RGA installed.
Checking Spec with Pumpdown Curves
In its simplest form, a pumpdown curve is actually used when checking a time-to-ultimate pump-down process specification. Although this is a useful procedure, it can only tell the operator that the system is or isn’t behaving the same way it usually does.
Graphing the entire pumpdown curve, however, from the onset of roughing to the final process pressure can provide a wealth of useful information. The actual shape of the curve is important. Vacuum gauge controllers that present time vs. pressure curves on their readout are commercially available.
When Should You Worry?
All vacuum systems should have a detailed pumpdown curve that has been recorded when the system is operating properly. If this curve is used as the “standard”, then subsequent curves can be compared to it. If you ever see the shape of the curve vary, there is a reason and you should investigate.
If you see a single deviation, it might not be important. However, if you see the deviation again in the same direction, it could signal a real problem and offer you an early warning that problems are building up.
Case Example: Operator sees a slight shifting of the roughing portion of the curve in a cryo-pumped system that includes an oil-sealed roughing pump. Possible root cause—condensed water vapor building up within the pump which could cause problems in time. Cryopumps have a high pumping speed for water vapor and would probably mask this effect if a full pump-down curve wasn’t observed and/or recorded. This is an evolving problem that an RGA might initially miss. Being vigilant with your pumpdown curve habits would likely catch this issue early allowing it to never get to the point where it becomes a production-halting problem.
In a future blog, we will cover the importance of Rate-of-Rise curves, and how they could be even more important than pumpdown curves.
Until then, check out an easy and accurate way to create pumpdown curves with the Bullseye Precision Gauge.


